vSphere Performance data - New vSphere plugin for Telegraf
Recently there was a new release of Telegraf, a monitoring agent from the guys that built InfluxDB. This new version, 1.8.0, comes with a plugin for vSphere which I'm pretty excited about!
Previously I've been testing Telegraf for monitoring some Linux VMs and also my InfluxDB servers and the agent works as expected and it's as easy to use as the other products in the TICK stack from Influx.
If you've followed my blog series about building a monitoring solution for vSphere and other infrastructure components you know that I've pulled metrics with PowerCLI scripts. With this new plugin to Telegraf I want to see if I can use this as a replacement.
UPDATE: I have a new blog series covering how to set up vSphere monitoring with Telegraf, InfluxDB and Grafana 7. Please check it out
First of, we need to download and upgrade to the new Telegraf package. Check out the download page or upgrade through the repo if you've set this up.
On RHEL/CentOS which I'm using I'll do a
sudo systemctl update telegraf
For other distros/OS'es or a fresh install check out the docs mentioned above.
After upgrading you'll have a new config file in your telegraf folder, /etc/telegraf/telegraf.conf.rpmnew , which includes the new settings in this version. If you're doing a fresh install you'll have all new settings in your telegraf.conf file.
After merging in my existing settings in to the rpmnew file I do a backup of the existing .conf file and then make the .rpmnew file the new config file.
sudo cp /etc/telegraf/telegraf.conf /etc/telegraf/telegraf.conf.bak
sudo mv /etc/telegraf/telegraf.conf.rpmnew /etc/telegraf/telegraf.conf
Now, let's check out the new vSphere settings (documented here)!
The important part is obviously how you connect to vCenter:
# Read metrics from one or many vCenters
[[inputs.vsphere]]
    ## List of vCenter URLs to be monitored. These three lines must be uncommented
  ## and edited for the plugin to work.
  vcenters = [ "https://vcenter.local/sdk" ]
  username = "user@corp.local"
  password = "secret"
and the SSL specifics:
## Optional SSL Config
  # ssl_ca = "/path/to/cafile"
  # ssl_cert = "/path/to/certfile"
  # ssl_key = "/path/to/keyfile"
  ## Use SSL but skip chain & host verification
  # insecure_skip_verify = false
Note if you run without trusted certs you'll need to uncomment the last line here and set it to true
There are a bunch of other settings as well, things like default timeout, rediscovery time etc. Again, check out the docs for more.
The actual metrics to pull is also documented of course, and in my initial testing I will run with the defaults which will pull all available metrics. If you want you can include or exclude what you want, which I will be looking into if and when we are replacing the scripts which pulls data in production.
If you haven't been using Telegraf on the server before you will also need to configure the connection to your InfluxDB server. This is done at the top of the telegraf.conf file. If the telegraf service is running on the same server as your InfluxDB you could go with the defaults and Telegraf will try to connect on localhost:8086 and create a database called Telegraf.
After configuring the plugin with the settings you want you need to restart the telegraf service on your collector and verify that things are running.
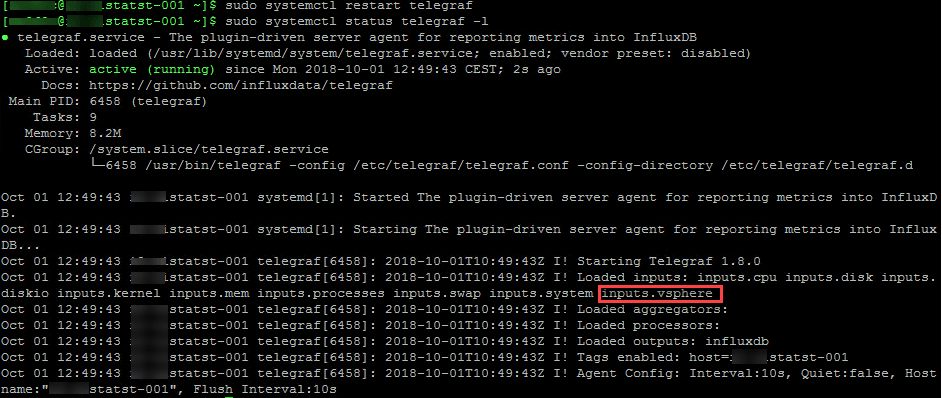
Telegraf service status
Note that the vsphere plugin has been loaded.
Now you should have some new measurements in InfluxDB under the Telegraf database (or whatever database you've configured Telegraf to use) with vSphere data:
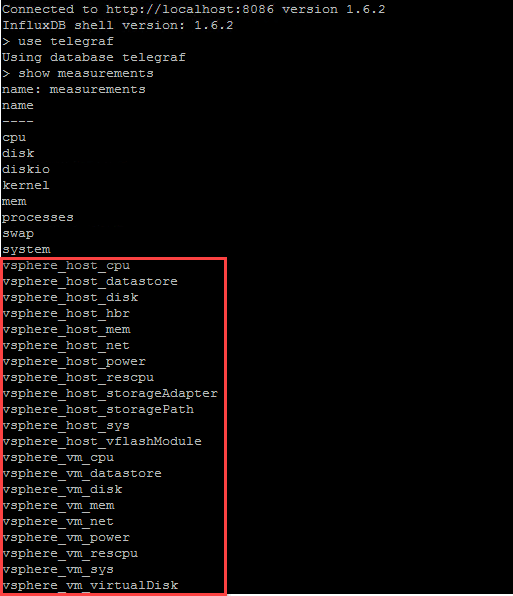
vSphere measurements in influx
Let's head over to Grafana and see if we can use the data over there
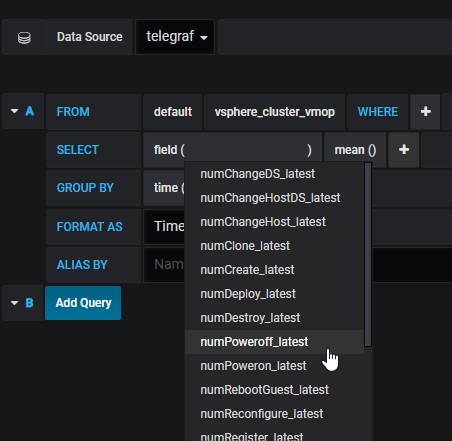
vSphere measurements in Grafana
As we can see we have lots of data available, stuff like number of powered on/off machines, reboots, vmotions etc looks like something we can create some interesting dashboards from. Here's just a quick example of some cluster stats.
Grafana dashboard with vSphere data collected by Telegraf
I will do some more investigating into the Telegraf plugin to see if we can use it in our environment. It seems interesting, and it sure is a really quick way to get started, but in our case it will miss some enrichment metadata / tags (like internal companycode etc) which are done by our scripts. One example of this is that we are using tags to align VMs to SAN through a datastore tag on each VM point. This way we can quickly see which VMs are running on a specific SAN etc.
In a production setup we will also check out the concurrency settings for the plugin, I will assume that the default will not be sufficient when pulling thousands of VMs. We also need to check the load put on our vCenters as this is kind of a no go. Hopefully I'll be able to find some time for this during the next weeks.