Exploring the TICK stack
For those of you that have read my blog you probably know I've done a series on performance monitoring infrastructure with the help of InfluxDB.
InfluxDB is a part of the TICK stack delivered by InfluxData. All components are open-sourced and available. The TICK stack consists of, Telegraf, InfluxDB, Chronograf and Kapacitor.
This post will do a quick review and some examples on how I have started exploring them in my Performance monitoring project.
To start of the TICK stack is documentated at docs.influxdata.com. The product documentation is very good and gives a lot of insight into how to get started with the products.
The different components in the TICK stack and their use cases:
- Telegraf, an agent for collecting metrics and pushing to a specified output (for instance InfluxDB)
- InfluxDB, our time-series database
- Chronograf, a web gui to control the TICK stack
- Kapacitor, a data processing engine capable of speaking InfluxQL
As I mentioned at the end of my post Some InfluxDB gotcha’s I found that these components solves some challenges I have in my project.
Goals
The main challenges I wanted to combat was aggregation of raw metrics in an easy way. InfluxDB has a built-in function for this, Continuous queries (CQ), but with Kapacitor (via Chronograf) you will have a GUI for creating the needed query and an easy way to enable/disable the job. More important would be that it gives a bit more visibility as there is no need for logging in to the InfluxDB and check what CQ's are running. If you have the need for complex queries you could also find that CQ's wont be enough.
I also wanted to explore if I could join two metrics in one. I have a couple of Throughput metrics in my project which are divided in Read and Write. While this gives us great insight and granularity there are times we want to have the total usage and in those cases we need to manually combine or do some other magic outside of Influx as there are no Join functions in InfluxDB.
Kapacitor can also do alerting based on the InfluxDB data. For instance if the metric x goes above the value y, or if metric x for some reason stopped receiving data.
Telegraf
A prerequisite for Kapacitor (besides the InfluxDB) is Telegraf. In my environment we use System Center Operations Manager for monitoring so Telegraf wasn't something I initially thought of exploring. Telegraf is really lightweight and integrates nicely in to Influx (naturally, as they're both made by the same people).
Telegraf works on the concept of Input and Output plugins. Input is what the agent is collecting data from whereas Output is where Telegraf is pushing it's data. While taking a closer look on the available Input plugins I do think this could be used in other projects as well as in my performance solution.
With that I downloaded and installed Telegraf on the InfluxDB server. For both Input and Output I would use InfluxDB and the default configuration is fine as InfluxDB is installed on the same server. To start pulling and pushing metrics I only had to uncomment the Influx config in the /etc/telegraf/telegraf.conf file and restart the Telegraf service.
Kapacitor
With Telegraf installed I went on with installing Kapacitor. I didn't do much configuration as I wanted to check out what could be done through the Chronograf GUI.
Chronograf
I installed and started the Chronograf service and pointed my browser to the server on port 8888. The welcome page asks for the connection details for your InfluxDB and for the Telegraf database.
With that in and working you'll have your Influx server available in the Host list in Chronograf. This lists all hosts found in the Telegraf database which you pointed Chronograf to during setup. At this time we only have the one VM. By clicking the VM name you'll get a dashboard with some graphs showing things like CPU Usage, Disk used, Memory usage etc.
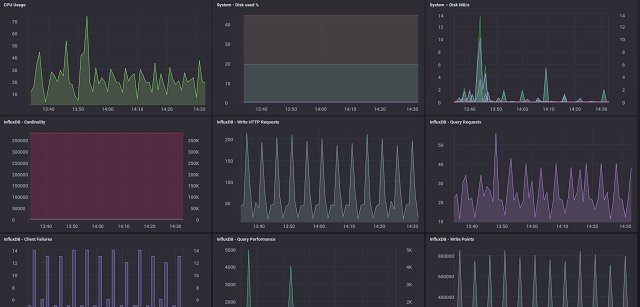
Chronograf dashboard
Chronograf also has a Dashboards section where you can create your own dasboards from multiple sources and endpoints. It's somewhat of a Grafana feel, but at the same time not.. I don't think we will shift to Chronograf from Grafana at this point.
I proceeded with connecting to the Kapacitor service which is done by pointing the connection to the correct URL and port (defaults to 9092). With a successful connection you get a new section where you will configure the Alert endpoints. This could be Slack, SMTP, HipChat and more. I configured the SMTP part to be able to send emails if needed.
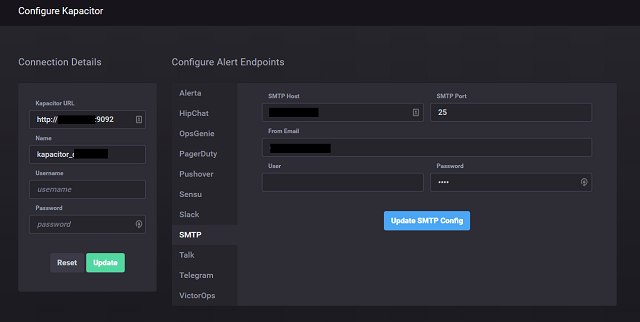
Connect to Kapacitor
That concluded my initial install and configuration of the components. With the help of the documentation the process is easy and straight forward.
I did one more thing before checking out Kapacitors processing powers and that was to install Telegraf also on the Grafana server. Here I activated the Kapacitor Input plugin and pointed the output to InfluxDB. With that I got two hosts in my Host list and with that I could also do some monitoring of the VMs in my project through Chronograf.
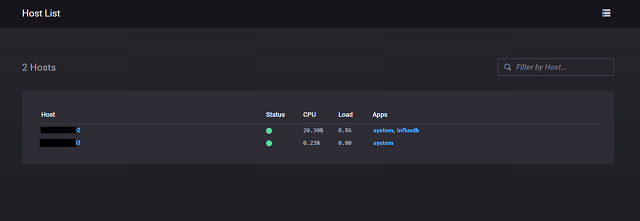
Host list
Data processing with Kapacitor
Kapacitor works on the concept of TICK scripts. A TICK script defines tasks to run against a data source. The tasks could be extracting, transforming and loading (ETL). In addition it can track and detect arbitrary changes and events.
The TICK script language uses pipelines for processing data. The building blocks are called Nodes. A node has some properties and some methods that can be performed.
A TICK script can do Stream and Batch processing. Stream will process data point by point as they are written to Influx. Batch will run on already written data.
I won't cover more on the TICK script language here. The product documentation does that far better than I could.
Just to show a quick example on how TICK script works I've pulled this from the documentation:
batch
    |query('SELECT * FROM "telegraf"."autogen".cpu WHERE time > now() - 10s')
        .period(10s)
        .every(10s)
    |httpOut('dump')
This script will run in Batch mode and will do a query against the cpu measurement in the telegraf database in Influx and pull all points from the last 10 seconds. The result is passed to the httpOut() method. HttpOut caches the data it receives in the given endpoint, in this case the "dump" endpoint.
To start of with my data I tested two different TICK scripts:
Aggregation
The first was for aggregating 20 second interval metrics to a 5 minute interval.
batch
    |query('SELECT mean(value) as avg,max(value) FROM performance.autogen.cpu_usage')
        .period(5m)
        .every(5m)
        .groupBy(*)
    |influxDBOut()
        .database('performance')
        .retentionPolicy('agg_5m')
        .measurement('cpu_usage')
        .precision('s')
This script starts as a Batch task. It has a query node which runs a query against the cpu_usage measurement in the performance.autogen database. It selects the mean and max value and the result is piped to the influxDBOut() chaining method which puts the results in the performance.agg_5m database and the cpu_usage measurement. It runs every 5 minute and in each run it will work on the last 5 minute period which is defined as property methods. Note the groupBy(*) property. This ensures that all my metadata tags will be kept and written to the new measurement.
Join
The second script was for joining two of my mentioned Throughput metrics.
var xRead = stream
    |from()
        .measurement('disk_iops_read')
        .groupBy(*)

var xWrite = stream
    |from()
        .measurement('disk_iops_write')
        .groupBy(*)

xRead
    |join(xWrite)
        .as('Read', 'Write')
    |eval(lambda: "Read.value" + "Write.value")
        .as('value')
    |influxDBOut()
        .database('performance')
        .retentionPolicy('autogen')
        .measurement('disk_iops_total')
This is a bit more complex. It starts by defining two variables, xRead and xWrite. These are both stream tasks which run against the measurements disk_iops_read and disk_iops_write in the performance.autogen database defined in their respective from() nodes and the **measurement() **method. I have also included the groupBy(*) as I did in the first example.
Then the script grabs the results in the xRead variable and pushes it through the join() chaining method against the xWrite variable. It uses the as() property method to name the fields from the respective nodes. Then it runs through the eval() chaining metod. This method uses a lambda evaluation function to sum the values of the two fields to a "value" field specified in the as() property method. Finally the result of the lambda evaluation is pushed through the influxDBOut() chaining method and written to the measurement and database specified in the respective property methods.
The process of building and activating these TICK scripts are quite easy. In my case I have a lot of measurements and most of them is subject for some kind of aggregation. With the capabilities in Chronograf I can easily copy/paste a working TICK script and adjust the measurement names to create a new one. Chronograf also gives a nice overview of the TICK scripts available and if it's enabled or not.
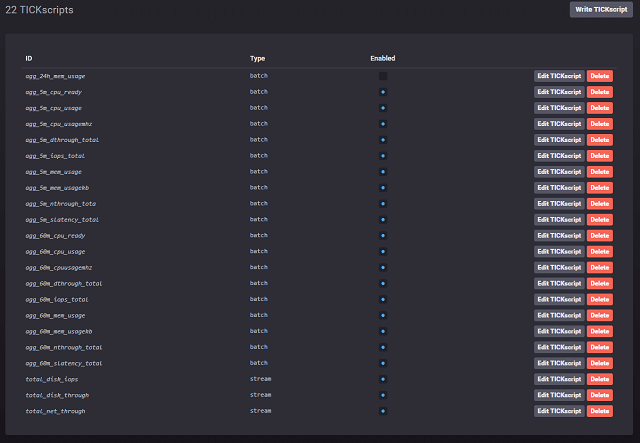
TICK script overview
The same output can of course be found through the command line:
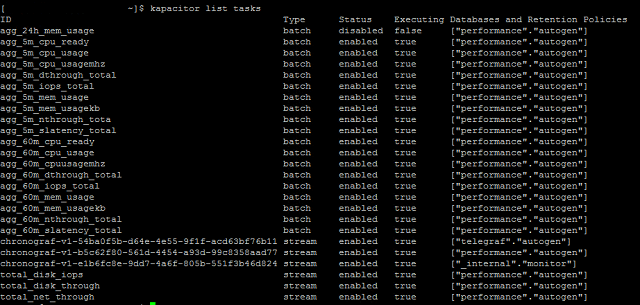
Command line overview
With the command line you can also get some stats and information about a specific task
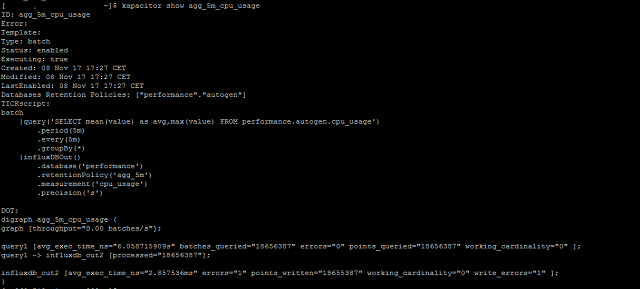
Task details
While my first task, the Aggregation, could be setup through Continuous Queries in InfluxDB I think it's much nicer to have it done by Kapacitor. It gives a much more easy overview of the tasks that are running, and an easy way of disabling if needed.
As we go forward I suspect we will do some more processing with Kapacitor. It has lots of possibilities. I also want to explore Telegraf more, but then probably outside of the Performance monitoring project. With lots of possible Input (and output) plugins we have several use cases where we could check out the capabilities