vSphere Performance data – Part 7 – More data
This is Part 7 of my series on vSphere Performance data.
Part 1 discusses the project, Part 2 is about exploring how to retrieve data, Part 3 is about using Get-Stat for the retrieval. Part 4 talked about the database used to store the retrieved data, InfluxDB. Part 5 showed how data is written to the database. Part 6 was about creating dashboards to show off the data. This post adds even more data to the project!
One thing I've learned by this project is that when you gather data you are always looking out for other data sources to add! Until now we've seen how we have retrieved metrics from all VMs in our environment on 20 second intervals. But what about the ESXi hosts running those VMs? And what about the Storage arrays they use?
Well, of course we need to add those to the mix!
ESXi hosts
Adding data from the ESXi hosts was quite easy. As the Get-Stat cmdlet we used to get the stats from VMs also works on the hosts there was only a matter of checking the available metrics and decide on which ones we wanted.
As we saw when exploring stats for the VMs there are only a subset that are available when omitting the -Realtime parameter
PS C:\> Get-StatType -Entity esx001
cpu.usage.average
cpu.usagemhz.average
cpu.ready.summation
mem.usage.average
mem.swapinRate.average
mem.swapoutRate.average
mem.vmmemctl.average
mem.consumed.average
mem.overhead.average
disk.usage.average
disk.maxTotalLatency.latest
disk.numberReadAveraged.average
disk.numberWriteAveraged.average
net.usage.average
sys.uptime.latest
datastore.numberReadAveraged.average
datastore.numberWriteAveraged.average
datastore.totalReadLatency.average
datastore.totalWriteLatency.average
datastore.datastoreIops.average
datastore.sizeNormalizedDatastoreLatency.average
datastore.siocActiveTimePercentage.average
clusterServices.cpufairness.latest
clusterServices.memfairness.latest
datastore.datastoreReadIops.latest
datastore.datastoreWriteIops.latest
datastore.datastoreReadOIO.latest
datastore.datastoreWriteOIO.latest
datastore.datastoreVMObservedLatency.latest
disk.deviceLatency.average
disk.maxQueueDepth.average
datastore.datastoreMaxQueueDepth.latest
With the -Realtime parameter we get a lot more
PS C:\> Get-StatType -Entity esx001 -Realtime
cpu.coreUtilization.average
cpu.costop.summation
cpu.demand.average
cpu.idle.summation
cpu.latency.average
cpu.readiness.average
cpu.ready.summation
cpu.reservedCapacity.average
cpu.swapwait.summation
cpu.totalCapacity.average
cpu.usage.average
cpu.usagemhz.average
cpu.used.summation
cpu.utilization.average
cpu.wait.summation
datastore.datastoreIops.average
datastore.datastoreMaxQueueDepth.latest
datastore.datastoreNormalReadLatency.latest
datastore.datastoreNormalWriteLatency.latest
datastore.datastoreReadBytes.latest
datastore.datastoreReadIops.latest
datastore.datastoreReadLoadMetric.latest
datastore.datastoreReadOIO.latest
datastore.datastoreVMObservedLatency.latest
datastore.datastoreWriteBytes.latest
datastore.datastoreWriteIops.latest
datastore.datastoreWriteLoadMetric.latest
datastore.datastoreWriteOIO.latest
datastore.maxTotalLatency.latest
datastore.numberReadAveraged.average
datastore.numberWriteAveraged.average
datastore.read.average
datastore.siocActiveTimePercentage.average
datastore.sizeNormalizedDatastoreLatency.average
datastore.totalReadLatency.average
datastore.totalWriteLatency.average
datastore.write.average
disk.busResets.summation
disk.commands.summation
disk.commandsAborted.summation
disk.commandsAveraged.average
disk.deviceLatency.average
disk.deviceReadLatency.average
disk.deviceWriteLatency.average
disk.kernelLatency.average
disk.kernelReadLatency.average
disk.kernelWriteLatency.average
disk.maxQueueDepth.average
disk.maxTotalLatency.latest
disk.numberRead.summation
disk.numberReadAveraged.average
disk.numberWrite.summation
disk.numberWriteAveraged.average
disk.queueLatency.average
disk.queueReadLatency.average
disk.queueWriteLatency.average
disk.read.average
disk.totalLatency.average
disk.totalReadLatency.average
disk.totalWriteLatency.average
disk.usage.average
disk.write.average
hbr.hbrNetRx.average
hbr.hbrNetTx.average
hbr.hbrNumVms.average
mem.active.average
mem.activewrite.average
mem.compressed.average
mem.compressionRate.average
mem.consumed.average
mem.decompressionRate.average
mem.granted.average
mem.heap.average
mem.heapfree.average
mem.latency.average
mem.llSwapIn.average
mem.llSwapInRate.average
mem.llSwapOut.average
mem.llSwapOutRate.average
mem.llSwapUsed.average
mem.lowfreethreshold.average
mem.overhead.average
mem.reservedCapacity.average
mem.shared.average
mem.sharedcommon.average
mem.state.latest
mem.swapin.average
mem.swapinRate.average
mem.swapout.average
mem.swapoutRate.average
mem.swapused.average
mem.sysUsage.average
mem.totalCapacity.average
mem.unreserved.average
mem.usage.average
mem.vmfs.pbc.capMissRatio.latest
mem.vmfs.pbc.overhead.latest
mem.vmfs.pbc.size.latest
mem.vmfs.pbc.sizeMax.latest
mem.vmfs.pbc.workingSet.latest
mem.vmfs.pbc.workingSetMax.latest
mem.vmmemctl.average
mem.zero.average
net.broadcastRx.summation
net.broadcastTx.summation
net.bytesRx.average
net.bytesTx.average
net.droppedRx.summation
net.droppedTx.summation
net.errorsRx.summation
net.errorsTx.summation
net.multicastRx.summation
net.multicastTx.summation
net.packetsRx.summation
net.packetsTx.summation
net.received.average
net.transmitted.average
net.unknownProtos.summation
net.usage.average
power.energy.summation
power.power.average
power.powerCap.average
rescpu.actav1.latest
rescpu.actav15.latest
rescpu.actav5.latest
rescpu.actpk1.latest
rescpu.actpk15.latest
rescpu.actpk5.latest
rescpu.maxLimited1.latest
rescpu.maxLimited15.latest
rescpu.maxLimited5.latest
rescpu.runav1.latest
rescpu.runav15.latest
rescpu.runav5.latest
rescpu.runpk1.latest
rescpu.runpk15.latest
rescpu.runpk5.latest
rescpu.sampleCount.latest
rescpu.samplePeriod.latest
storageAdapter.commandsAveraged.average
storageAdapter.maxTotalLatency.latest
storageAdapter.numberReadAveraged.average
storageAdapter.numberWriteAveraged.average
storageAdapter.read.average
storageAdapter.totalReadLatency.average
storageAdapter.totalWriteLatency.average
storageAdapter.write.average
storagePath.commandsAveraged.average
storagePath.maxTotalLatency.latest
storagePath.numberReadAveraged.average
storagePath.numberWriteAveraged.average
storagePath.read.average
storagePath.totalReadLatency.average
storagePath.totalWriteLatency.average
storagePath.write.average
sys.resourceCpuAct1.latest
sys.resourceCpuAct5.latest
sys.resourceCpuAllocMax.latest
sys.resourceCpuAllocMin.latest
sys.resourceCpuAllocShares.latest
sys.resourceCpuMaxLimited1.latest
sys.resourceCpuMaxLimited5.latest
sys.resourceCpuRun1.latest
sys.resourceCpuRun5.latest
sys.resourceCpuUsage.average
sys.resourceFdUsage.latest
sys.resourceMemAllocMax.latest
sys.resourceMemAllocMin.latest
sys.resourceMemAllocShares.latest
sys.resourceMemConsumed.latest
sys.resourceMemCow.latest
sys.resourceMemMapped.latest
sys.resourceMemOverhead.latest
sys.resourceMemShared.latest
sys.resourceMemSwapped.latest
sys.resourceMemTouched.latest
sys.resourceMemZero.latest
sys.uptime.latest
vflashModule.numActiveVMDKs.latest
We started out with the following metrics:
- CPU Total capacity and utilization
- CPU Usage MHz and Percentage
- CPU Ready
- CPU Latency
- MEM Capacity and Consumed
- Net Receive and Transmit
- Storage Adapter Read and Write
Then I used the same script already built for the VM polling, modified it a bit, and started polling data.
And by polling host data to the same database as the VM data I found the need for adding the "type" metadata tag. Things like CPU Ready, Latency and Usage has the same metric names and would be treated as the same metric in my graphs. But of course I want to have the ability to filter on the actual type. We could have chosen to name the measurements differently, but we wanted to have it consistent. As I've explained before, adding metadata tags to the measurements is really easy. Just note that updating old points isn't necessarily that easy so be aware when you filter on previous data with those tags.
The full Host poller script is up on GitHub
Storage
We have a few HPE 3Par Storage Arrays in the environment. These SANs have an API available which can be used to poll data. I won't go into any details on how to use the API in this post but we are already using it to pull performance data to a traditional SQL database and present it on some dashboards.
As I stated earlier, we want to add more data sources in this project so we can get insights across technologies and components in the environment. So with that I could easily modify my existing script polling SAN performance stats and create a hashtable with 3Par measurements.
We have chosen to push things like IO Read/Write, KB Read/Write, Read and Write Latency and Queue lengths to the Influx DB. These stats are polled on a 5 minute interval. We have also added the Capacity / Used space metrics which will give us these numbers in the same dashboards. Although these doesn't change that rapidly they give us some great graphs for capacity planning across the environment.
New Dashboards
So with new data we could create new Dashboards :-)
Some examples of new panels created with this data
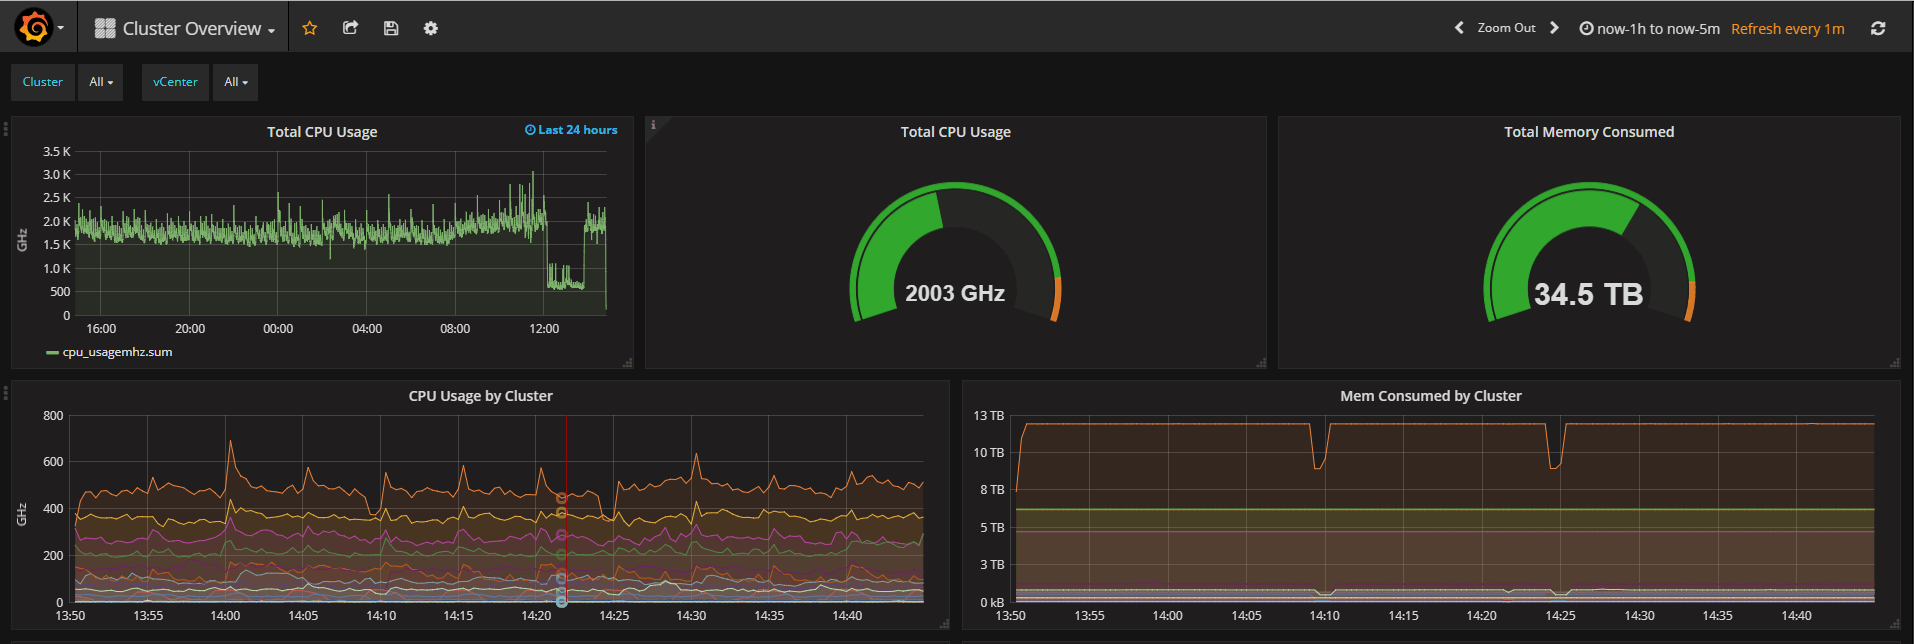
Host cluster performance
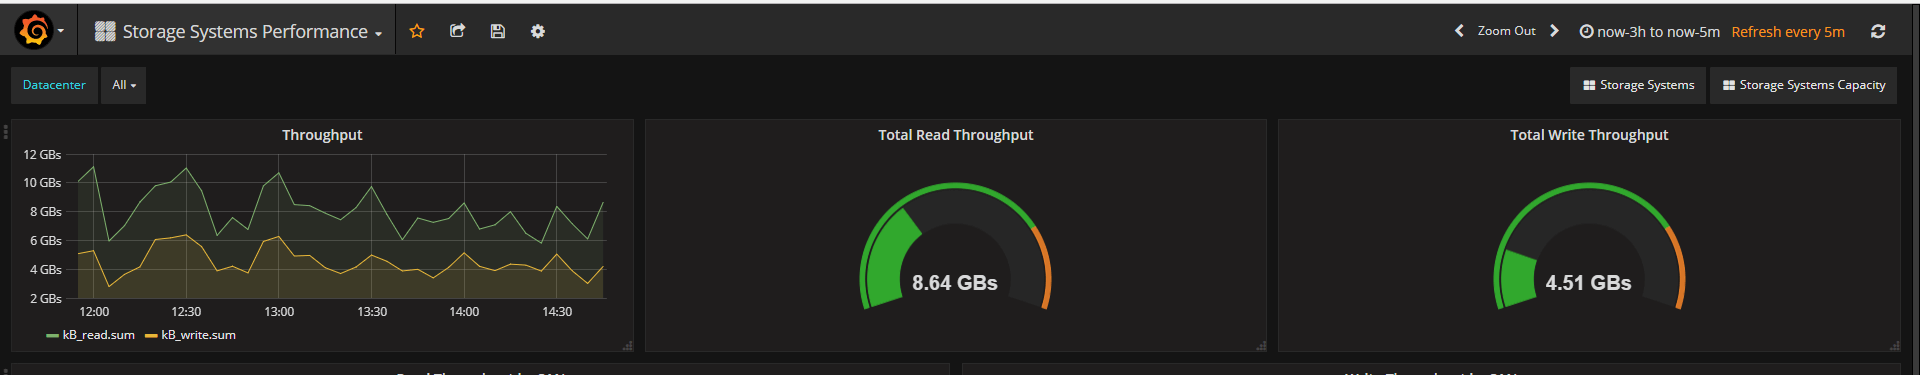
SAN Performance
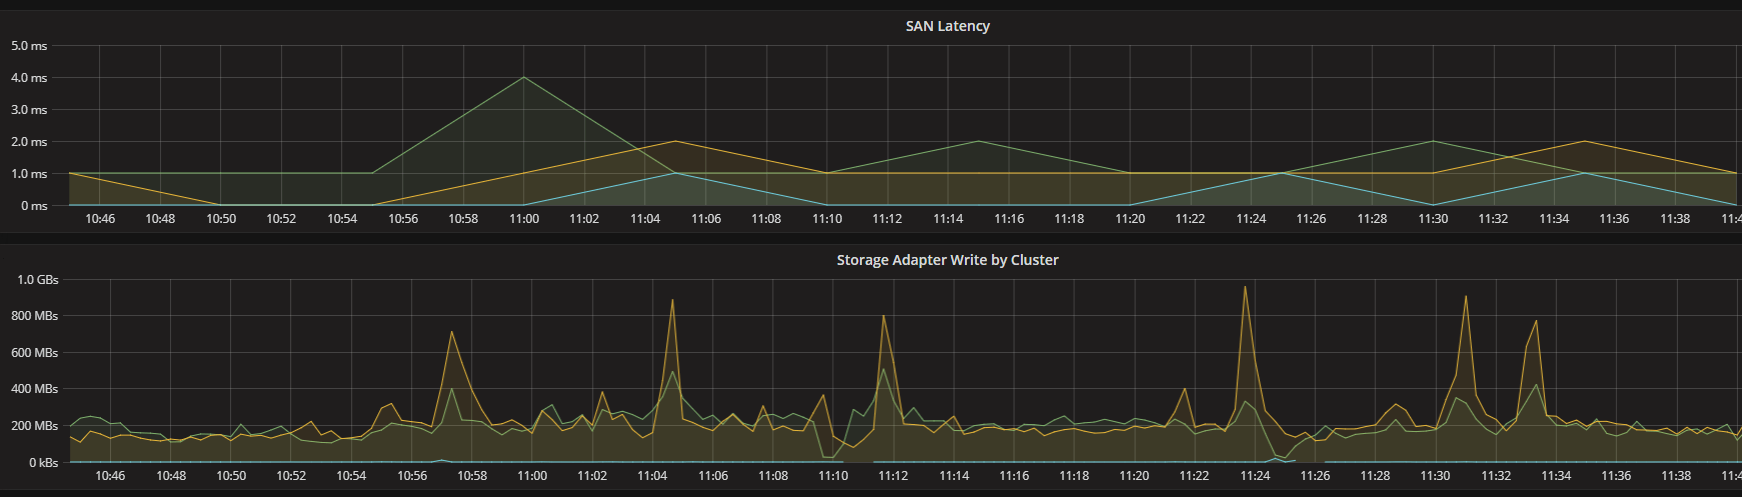
Compare Cluster write and SAN latency
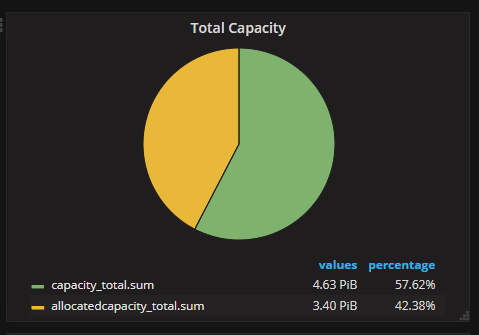
SAN Capacity
With the ability to get an overview of performance statistics on all infrastructure components across the environment we can quickly investigate and understand what is causing bottlenecks and failures. One example of this is shown in the Cluster Write / SAN latency. After a spike on the Storage adapter we see a small spike in SAN latency. We could now add storage traffic from the VMs as well and see the actual VM(s) that causes the spikes.
We are already discussing and investigating other sources to pull performance data from so I suspect we'll see a lot more data going forward.